Catalogue PIGMA
/Biological Environment/Species/Fish Species of Commercial Interest
Type of resources
Available actions
Topics
Keywords
Contact for the resource
Provided by
Years
Formats
Representation types
Update frequencies
status
Scale
-

This map presents NASC values (Nautical Area Scattering Coefficient) attributed to anchovy (Engraulis encrasicolus) in 2019, highlighting the regional abundance gradient of this species. The map was created through IDW interpolation applied to the results of the MEDIAS surveys (MEDiteranean International Acoustic Survey) conducted in the Mediterranean in 2019. Detailed information on the methodology for acquiring and processing acoustic data is available in the MEDIAS handbook. Additionally, details on the interpolation method used are provided in the report of the 16th working group meeting.
-
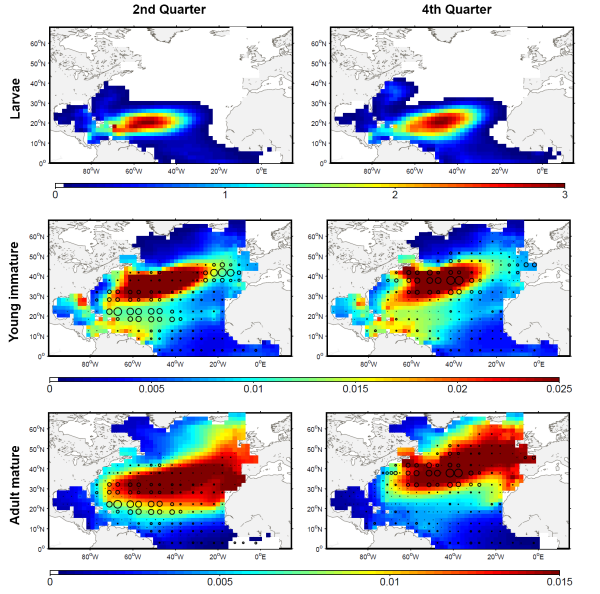
The development of the ecosystem approach and models for the management of ocean marine resources requires easy access to standard validated datasets of historical catch data for the main exploited species. They are used to measure the impact of biomass removal by fisheries and to evaluate the models skills, while the use of standard dataset facilitates models inter-comparison. North Atlantic albacore tuna is exploited all year round by longline and in summer and autumn by surface fisheries and fishery statistics compiled by the International Commission for the Conservation of Atlantic Tunas (ICCAT). Catch and effort with geographical coordinates at monthly spatial resolution of 1° or 5° squares were extracted for this species with a careful definition of fisheries and data screening. In total, thirteen fisheries were defined for the period 1956-2010, with fishing gears longline, troll, mid-water trawl and bait fishing. However, the spatialized catch effort data available in ICCAT database represent a fraction of the entire total catch. Length frequencies of catch were also extracted according to the definition of fisheries above for the period 1956-2010 with a quarterly temporal resolution and spatial resolutions varying from 1°x 1° to 10°x 20°. The resolution used to measure the fish also varies with size-bins of 1, 2 or 5 cm (Fork Length). The screening of data allowed detecting inconsistencies with a relatively large number of samples larger than 150 cm while all studies on the growth of albacore suggest that fish rarely grow up over 130 cm. Therefore, a threshold value of 130 cm has been arbitrarily fixed and all length frequency data above this value removed from the original data set.
-
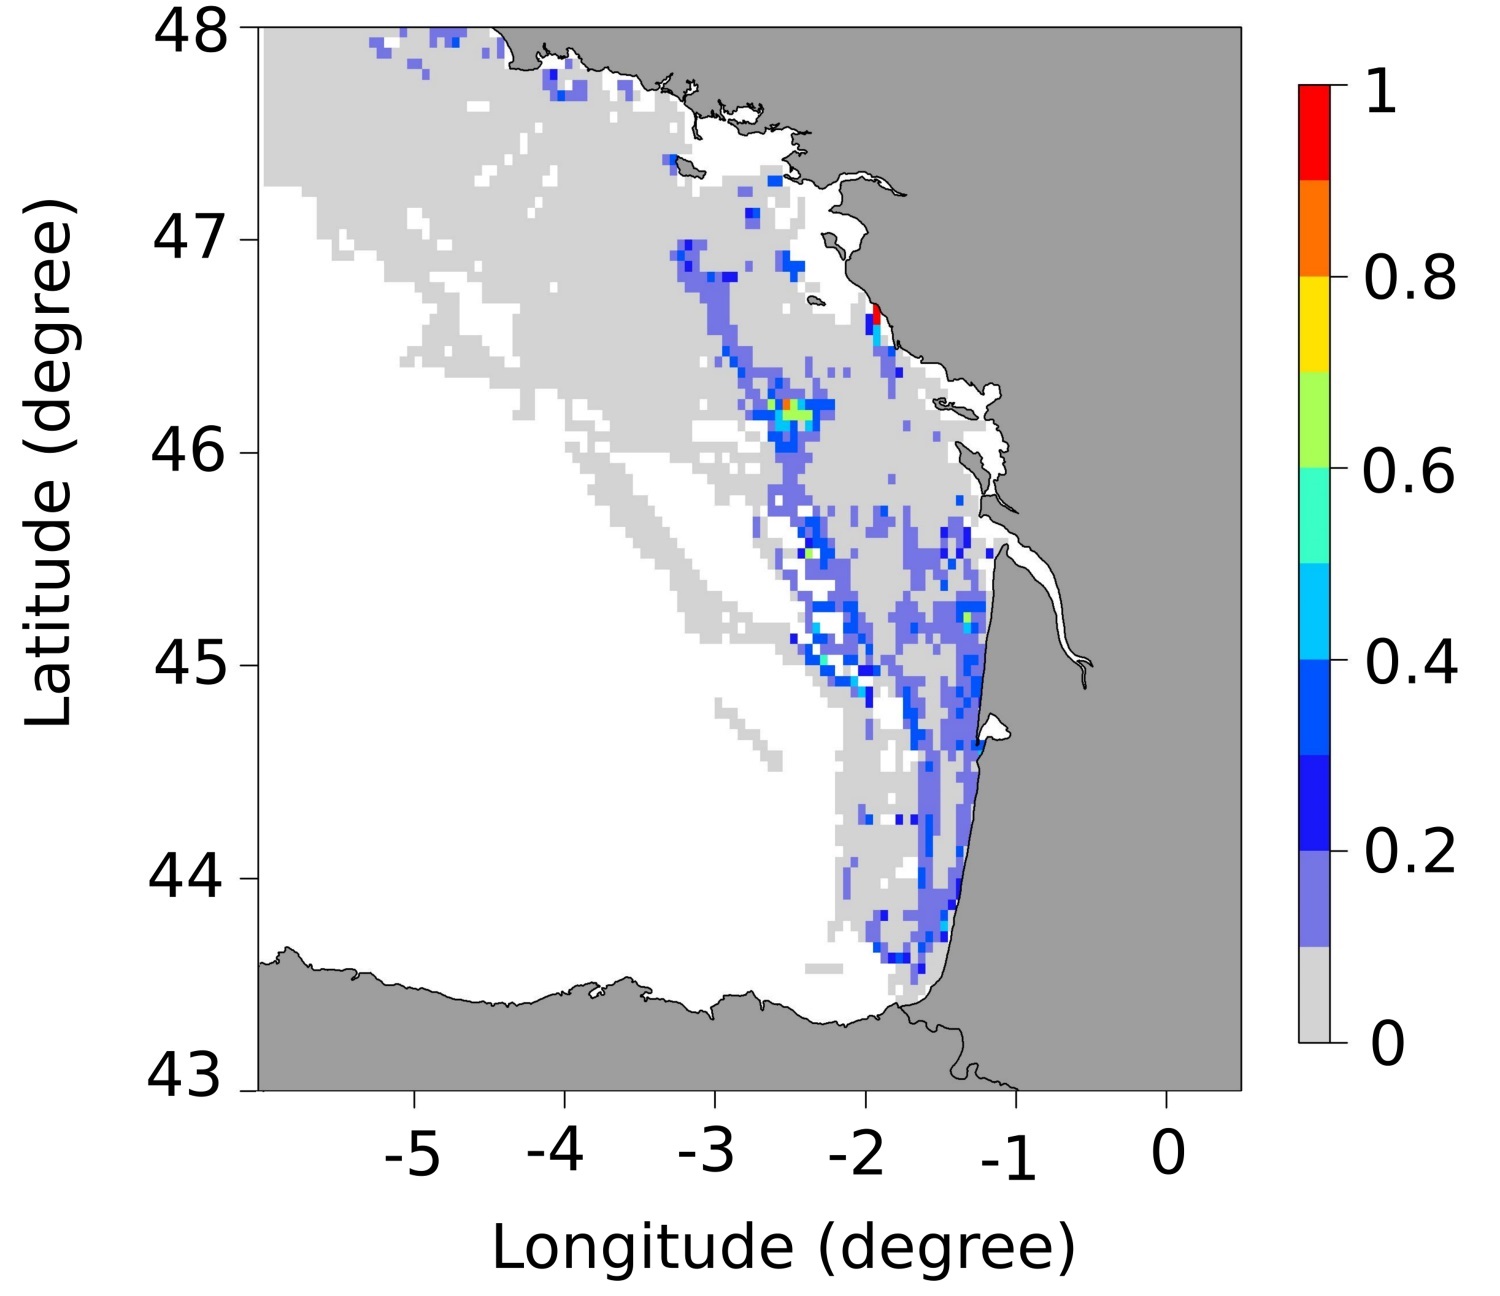
These maps represent the monthly probability of being a seabass spawning area for each month of the spawning season (January to March), and the mean probability of being a seabass spawning area over all spawning months in the Bay of Biscay. These probability maps were calculated by performing a geostatistical analysis of fishing data from geolocated vessels, and have a spatial resolution of 3 by 3 nautical miles.
-
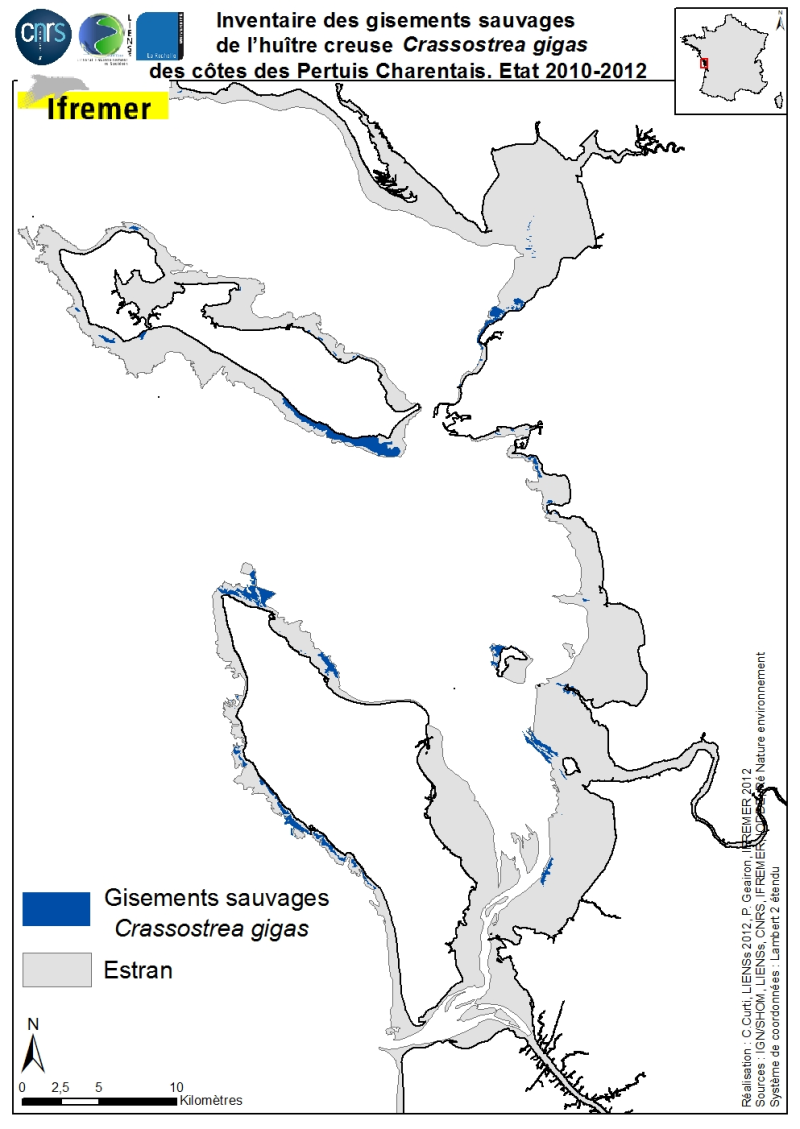
The geographical distribution of the main sources of wild Pacific oysters (Crassostrea gigas) (Thunberg, 1793) on the coasts of the Pertuis Charentais was compiled from 2010 to 2012. The inventory focuses on natural foreshore deposits (+ 6-0 m sea coast) and compiles two cartographic sources: 1) quantitative inventories made in 2010 by Ifremer from the Tranche sur Mer (Vendée) to Vaux-sur-Mer in 21 representative sites to estimate wild stocks of Pacific oysters and 2) inventory mapping of intertidal marine habitats mainly made by LIENSs (in cooperation with CREOCEAN, IODDE, Ré Nature Environnement and GEO-Transfert) under the project CARTHAM Natura 2000at sea of the Agency of Marine Protected Areas. Methodologies used by Ifremer to estimate the areas colonized combine thematic analysis in Geographic Information System (GIS) and field validations (Soletchnik et al., 2012). The methodologies used to estimate LIENSs extension of the intertidal habitat of the oysters combined aerial image analysis, remote sensing, field validations and thematic analysis using GIS (Cajeri et al., 2012).
-

The abundance of ichthyoplankton in samples from dedicated plankton surveys by Cefas with positional and sample data. Surveys took place off the Western Coast of the UK and Ireland between 1986 and 2004. Series of cruises undertaken to contribute to the estimation of the spawning stock biomass of the western mackerel and horse mackerel stocks by plankton survey. The triennial mackerel egg surveys were begun in 1977 to estimate the SSB of the western mackerel stock. Since 1986 the surveys have also been used to estimate the SSB of horse mackerel. Plankton sampling is undertaken to estimate the egg production and trawling is carried out to estimate the mean fecundity of the mature female fish. Various designs of Gulf VII type samplers have been used with various apertures of nosecones and 270 micron nets. Samplers are now standardised to the 53cm version, fitted with 20cm aperture nosecones. Analysis at Cefas involved separating all fish eggs and larvae from samples. Where possible all eggs were identified. Eggs lacking identifiable features were measured. Where >100 eggs were found, sub-sampling was undertaken. Eggs that were unmeasured were apportioned across the size distribution of measured eggs. All mackerel and horse mackerel eggs were staged.
-

The Commission for the Conservation Southern Bluefin Tuna collects a variety of data types from its Members and Cooperating Non-Members, including total catch, catch and effort data, and catch at size data. Catch, size and trade information is also collected through the Commission's Catch Documentation Scheme, Japanese import statistics, and other monitoring programs. Annual catches provided on this page are reported on a calendar year basis. CCSBT Members use quota years (not calendar years) for managing catching limits, but quota years differ between Members, so calendar years are used to provide catches on a common timescale. Relevant subsets and summaries of these data are provided below. All figures are subject to change as improved data or estimates become available. In particular, reviews of SBT data in 2006 indicated that southern bluefin tuna catches may have been substantially under-reported over the previous 10-20 years and the data presented here do not include estimates for this unreported catch. Also, data for the last reported year of catch (2020) are preliminary and are subject to revision. Any latitudes and longitudes presented in these summaries represent the north western corner of the relevant grid, which is a 5*5 grid unless otherwise specified. Other information on Members and Cooperating Non-Members fishing activities appears in the reports of the Extended Scientific Committee, Compliance Committee and Extended Commission.
-

The International Commission for the Conservation of Atlantic Tunas is an inter-governmental fishery organization responsible for the conservation of tunas and tuna-like species in the Atlantic Ocean and its adjacent seas. ICCAT compiles fishery statistics from its members and from all entities fishing for these species in the Atlantic Ocean, coordinates research, including stock assessment, on behalf of its members, develops scientific-based management advice, provides a mechanism for Contracting Parties to agree on management measures, and produces relevant publications. Science underpins the management decisions made by ICCAT. Much of the information available on this site relates to scientific data, reports of scientific meetings and to scientific articles.
-
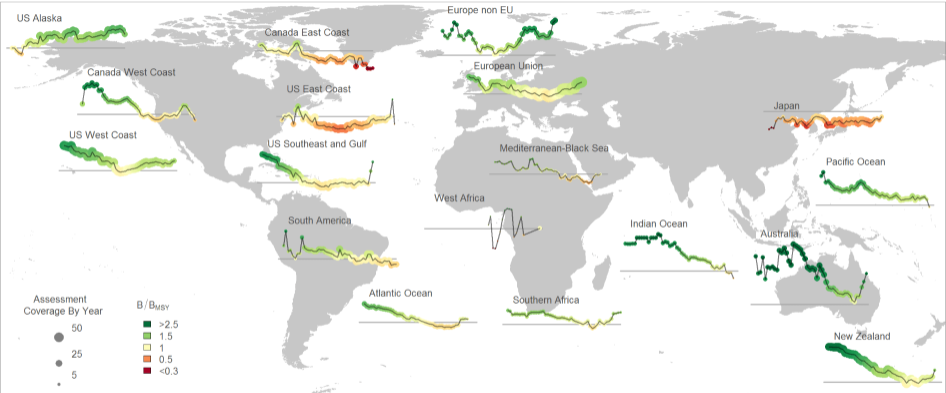
The RAM Legacy Stock Assessment Database is a compilation of stock assessment results for commercially exploited marine populations from around the world. The RAM Legacy Stock Assessment Database is grateful to the many stock assessment scientists whose work this database is based upon and the many collaborators who recorded the assessment model results for inclusion in the RAM Legacy Stock Assessment Database. Since 2011 the RAM Legacy Data base has been hosted and managed at the University of Washington with financial assistance from a consortium of Seattle-based seafood companies and organizations, and from the Walton Family Foundation. Initial development of the database from 2006-2010 was supported by the Census of Marine Life, Canadian Foundation for Innovation, NCEAS, NSERC, the Smith Conservation Research Fellowship, New Jersey Sea Grant, and the National Science Foundation.
-

-